Live Logs
The Debug tab has Console and Network sub-tabs, so you can watch the logs happening on the current page right inside the side panel. Logs are collected on their own in real time, so there's no need to refresh.
Both Console and Network also capture logs coming from other origins embedded in the page (iframes — say a payment widget or an embed). When logs from several origins are mixed in, an origin filter appears above the list. Click an origin button to see only its logs, and click it again to go back to everything (no selection means all). Logs without a clear origin are grouped under (unknown). Handy when you want to see only the logs from the page you're actually on.
Console
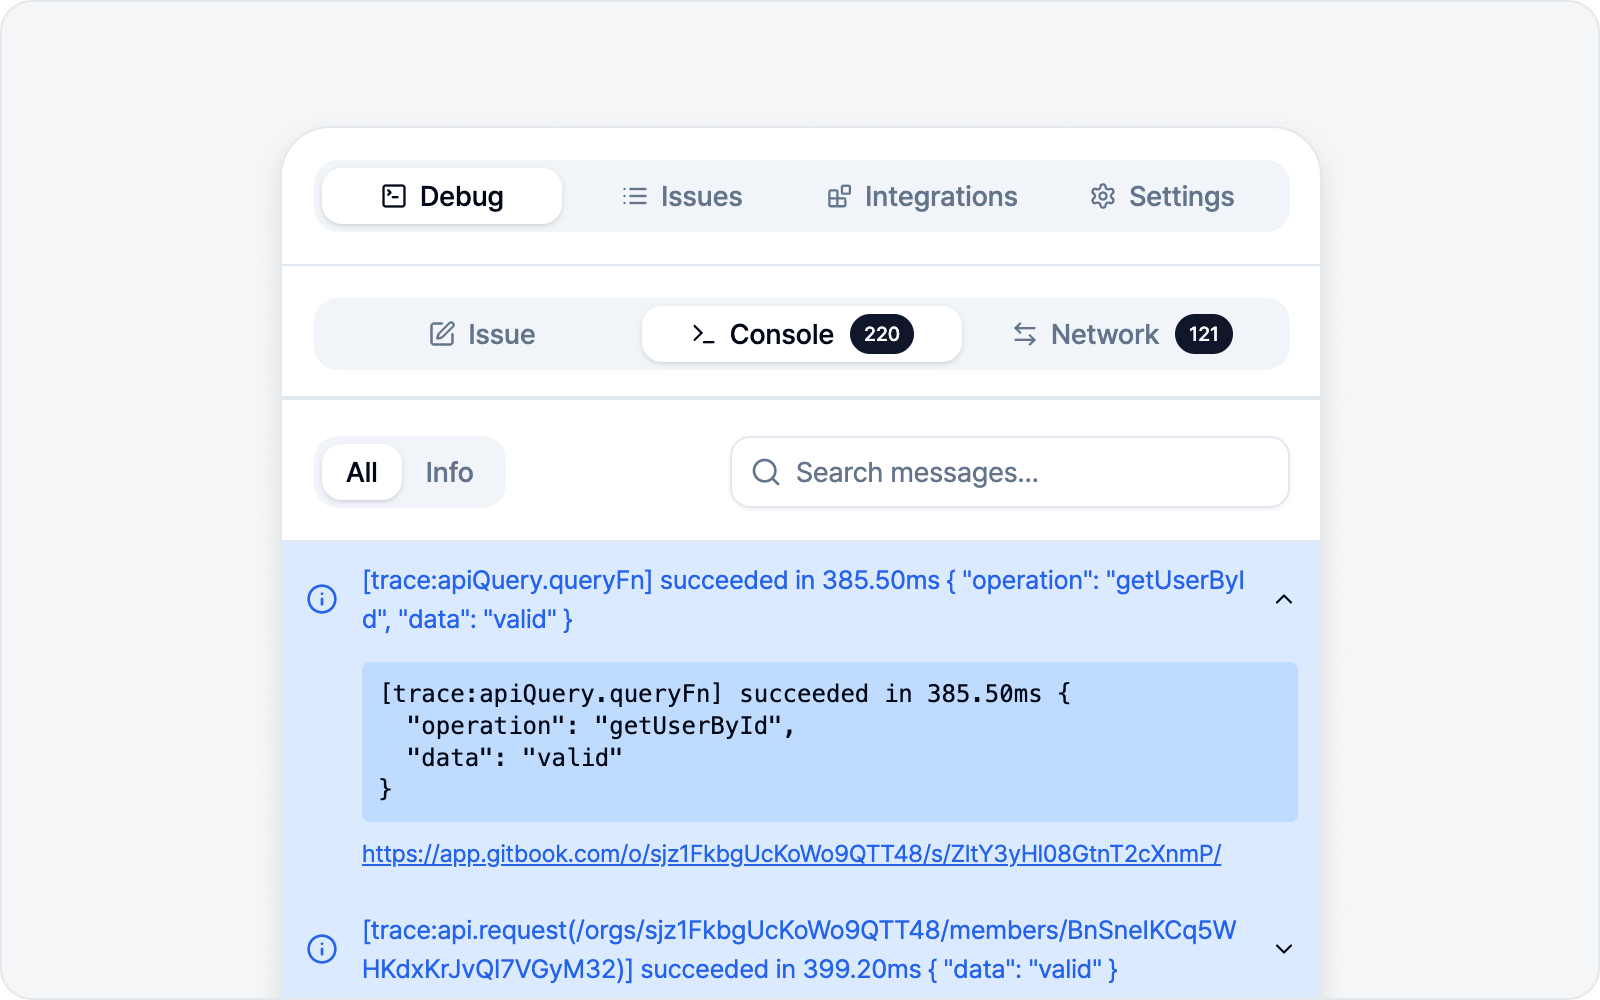 Console sub-tab
Collects the page's console output in full — info, warnings, and errors alike. Warnings and errors your code logs directly (console.warn, console.error), plus uncaught exceptions, are all captured, so nothing slips by.
- Filter / search — Filter by level (errors, warnings, and more) or find by keyword.
- Detail — Expand an entry to see the full contents.
- Clear Log — Empty the collected logs.
Network
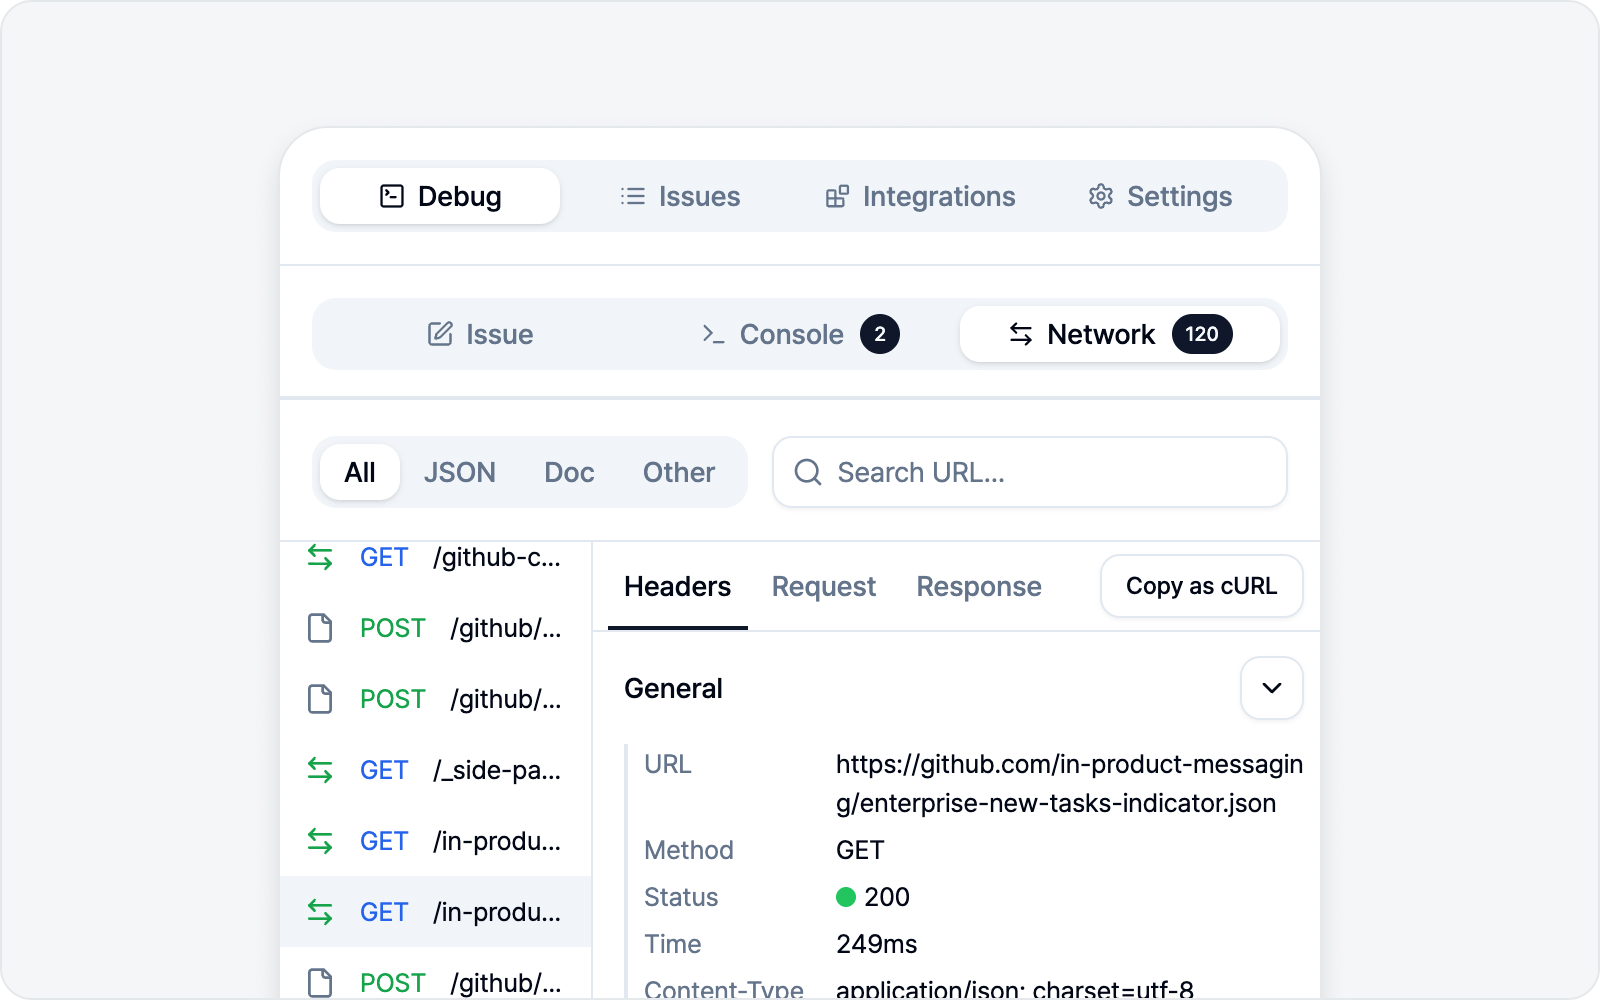 Network sub-tab
See the network requests made by the page.
- Filter / search — Filter requests by type, or find them with the search box. Search looks through not just the URL but also the request/response body and headers, so even if you don't remember the URL, a snippet from the response is enough to find it.
- Detail — Expand to see request and response contents.
- Copy as cURL — Copy a request as a cURL command to reproduce it in your terminal.
- Clear Log — Empty the collected logs.
WebSocket
If your page uses real-time, two-way communication (WebSocket), those connections show up in the network list too. Click the WS filter at the top to see just the WebSocket connections. Open a connection and the Messages tab appears, stacking the messages exchanged in time order — you can tell sent (▲) from received (▼) at a glance, and narrow by direction with All / Sent / Received. Click a message to expand its contents.
Text messages are captured. Binary messages like images or files are skipped without their contents, and the skipped count is shown above the Messages tab, so you'll know right away if anything was left out.
File an issue from logs alone (freeform)
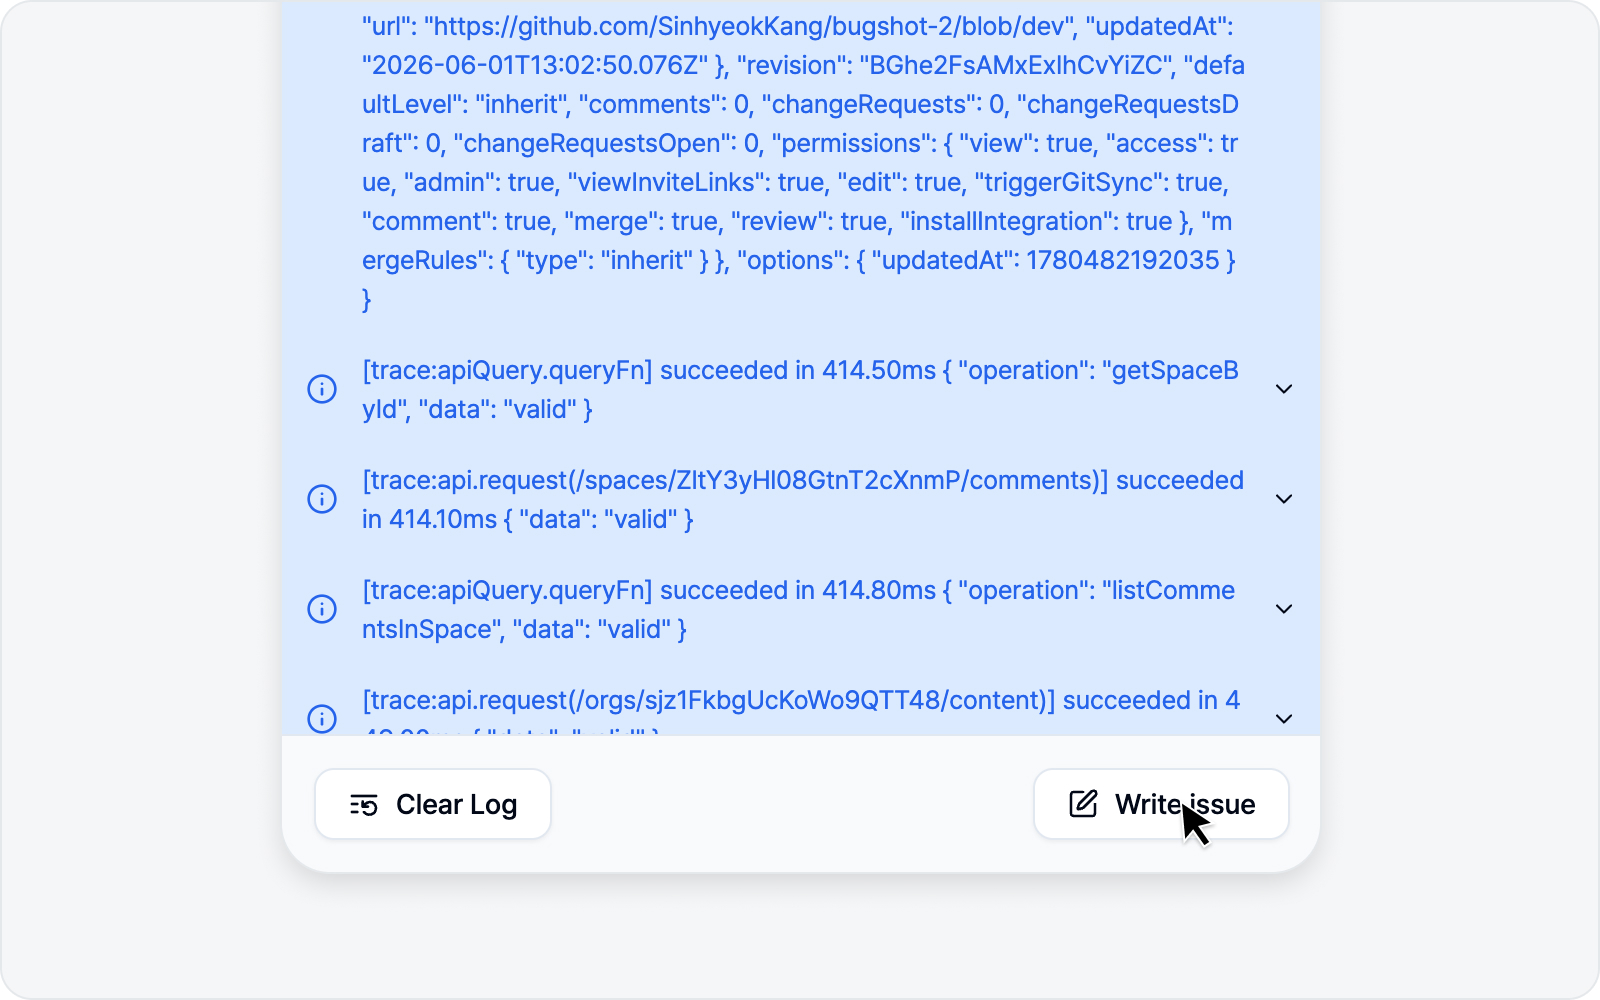 Filing a logs-only issue
You can also file an issue with logs only, no capture (element, screenshot, or video). While viewing the console or network, click Write issue to skip the capture step and go straight to the issue draft. Attach the console and network logs and submit.
The issue flow (title, body, preview, submit) is the same as the other modes. See the common steps in Write an Issue (screenshot).