Log Viewer
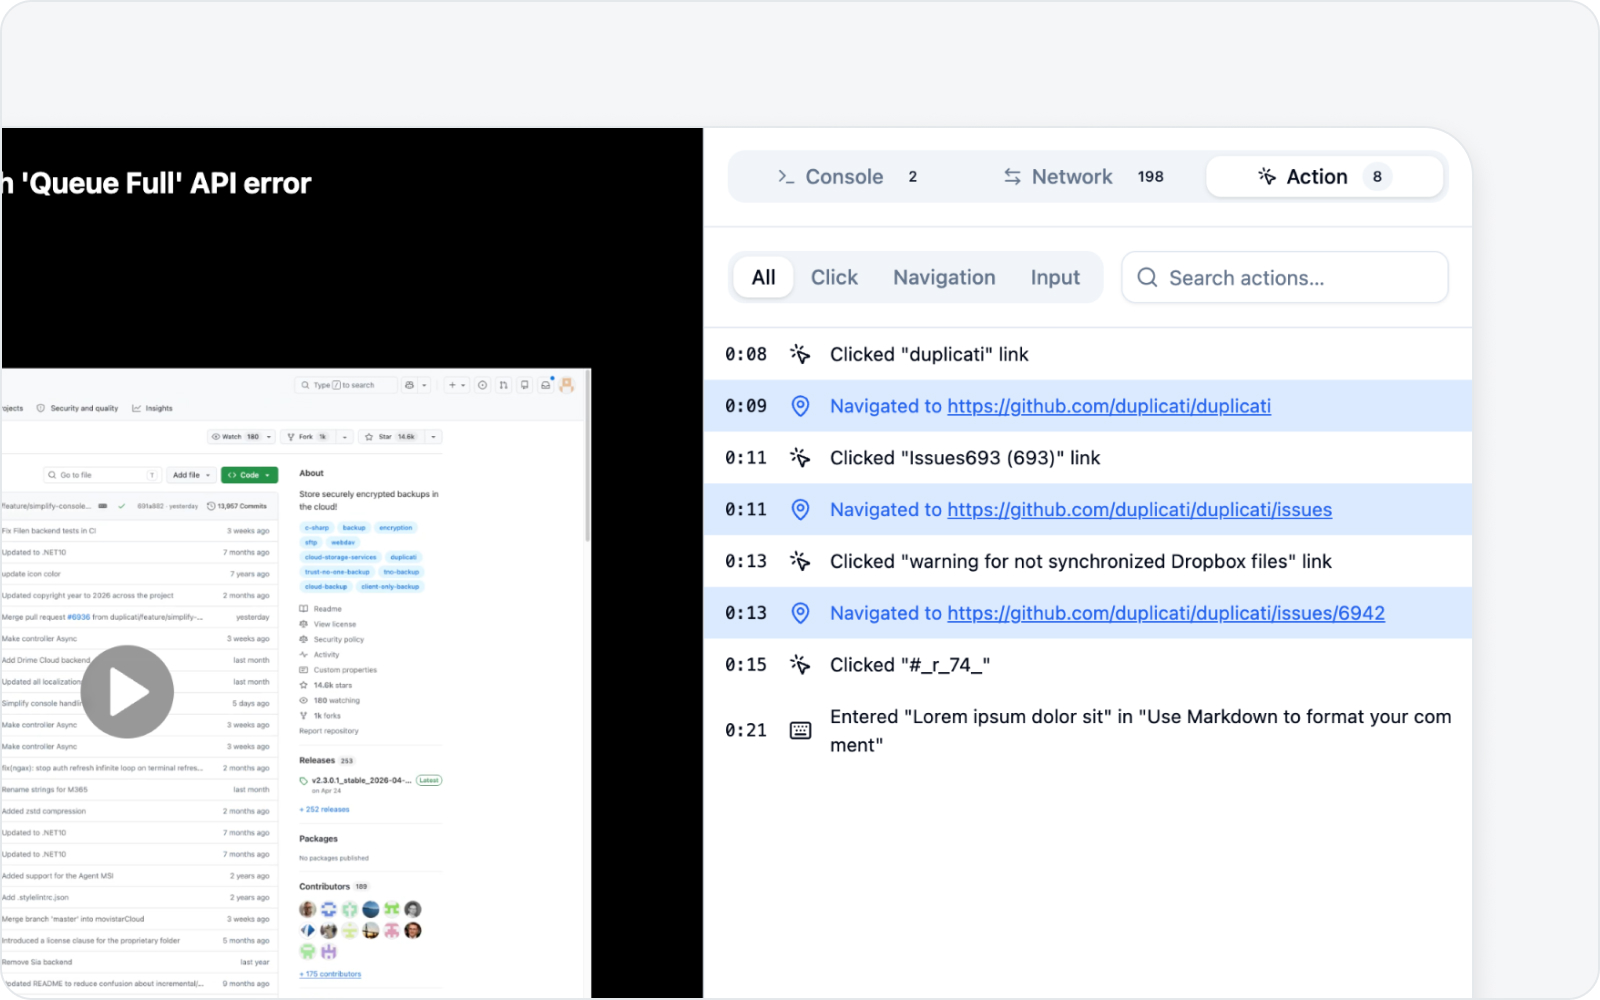
This page is from the angle of the developer who receives and works the bug. Issues filed with BugShot may carry a log report file (logs.html). Open it and you can view the video and the logs lined up by time on one screen. If the issue was filed in screenshot mode, the captured screenshot shows on the left instead of a video — it's static, with no playback or timeline, so you can glance at "what the screen looked like" while reading the logs.
How to open it
 Log viewer screen
Download the logs.html attached to the issue and open it in a browser. It's a single HTML file, so it opens right away with nothing to install — easy.
The receiver gets the file attached to the issue, but the person filing the bug can grab it ahead of time too. In the issue draft or preview screen, the Download button on the right of the Log attachments section pulls down the very same logs.html that gets attached — handy for checking it before you submit, or for sharing just the file without filing an issue at all.
Timeline markers
 Timeline markers
The screen has a timeline alongside the video, with logs plotted on it as markers. There are three kinds.
- Console — Console output and errors.
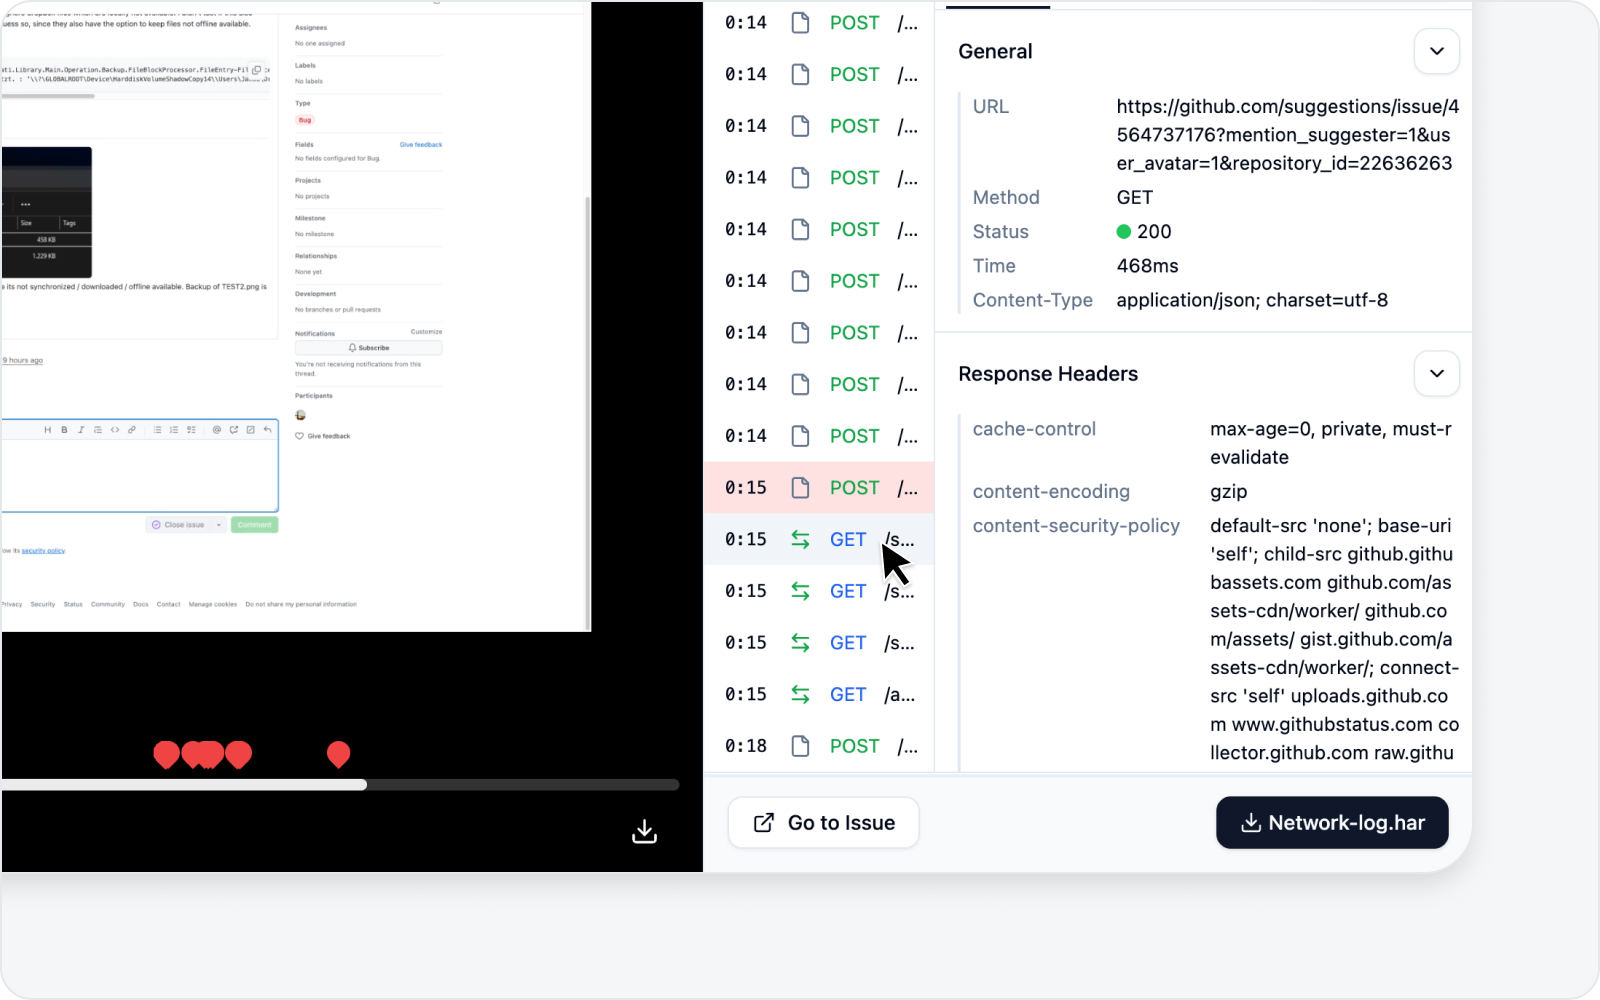
- Network — Network requests.
- Action — User actions: clicks, text input, and navigation, plus keyboard shortcuts and special keys, checkbox and radio toggles, dropdown selections, and drag-and-drop. (Navigation shows up as a kind of action marker.)
Logs from several origins (including iframes embedded in the page) all land on one timeline. In the Console, Network, and Action lists, an origin filter above the list lets you narrow down by origin, so you're never unsure which origin a log came from (each origin button also shows that origin's log count).
Video and logs in sync
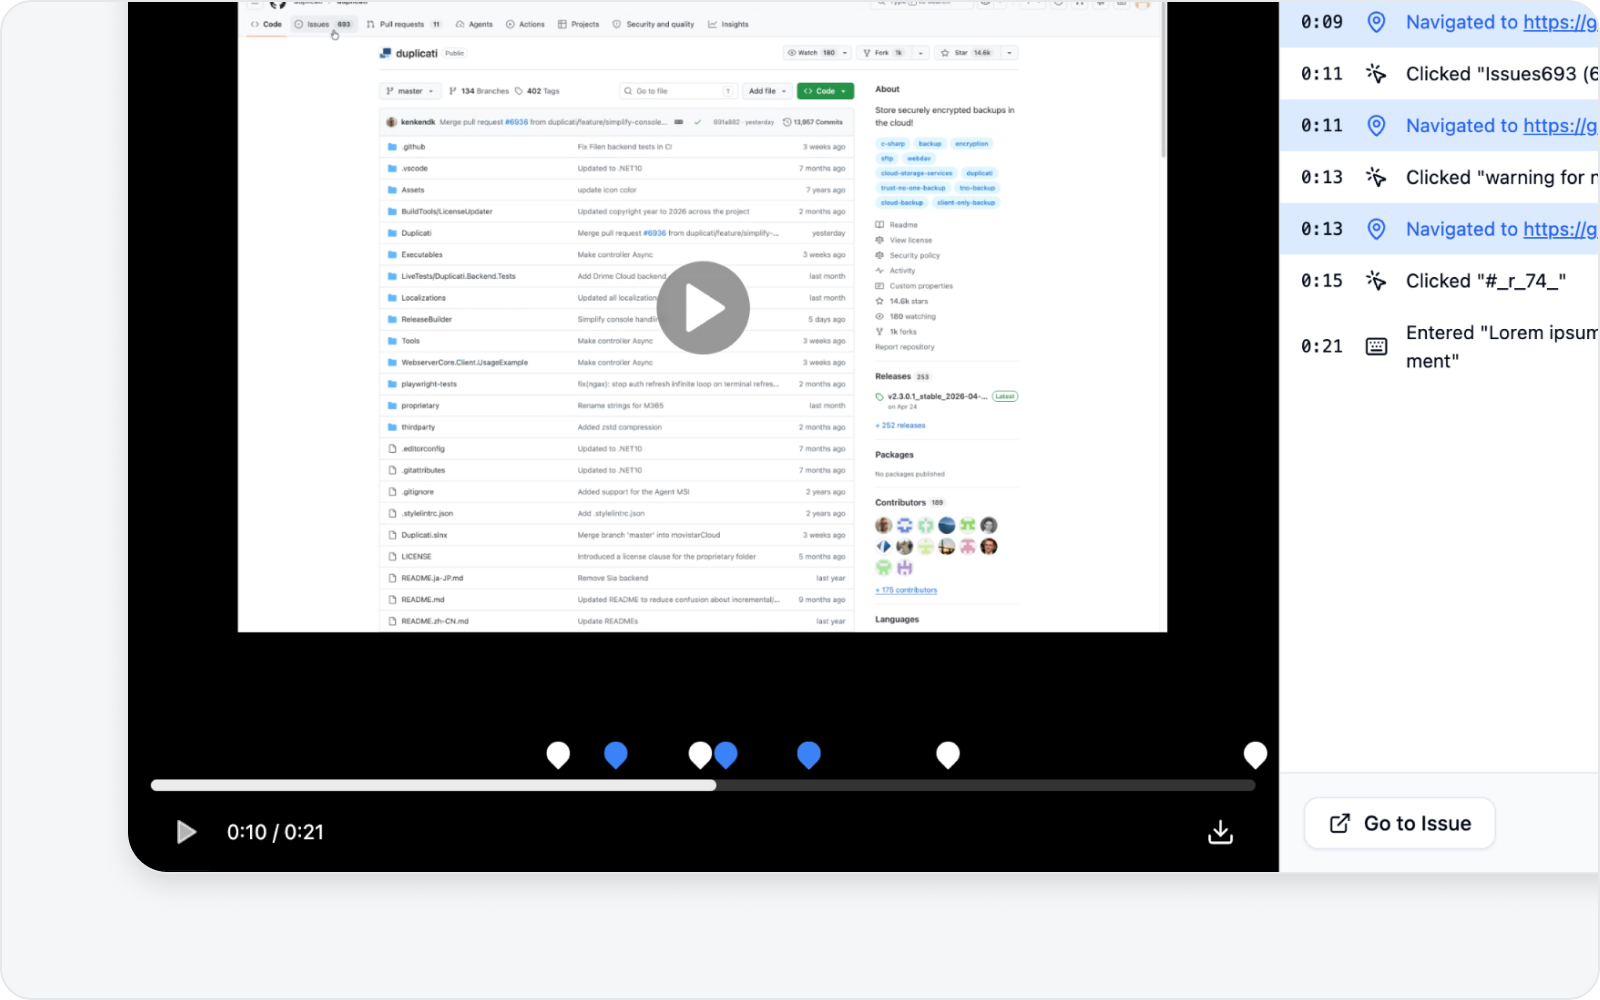
 Jump to a moment by clicking a marker
- Play the video and follow the logs at that point in time.
- Click a marker and the video jumps to that moment — see "what the screen looked like when this error fired" right away.
- Logs and video share one time axis, making it easy to follow the repro from start to finish.
Report tab
 Log viewer Report tab — title, environment, and body sections shown with inline images, plus a Copy markdown button in the top-right
It's not just video and logs — the issue write-up itself lives inside this file too. Click the Report tab at the top and you'll see the title, the environment, and the body sections (what happened, steps to reproduce, expected result) exactly as they were filed. Any images pasted into the body show up inline as well, so you can grasp "what the problem was" right here, without bouncing back to the original issue page.
- Want to take the content elsewhere? Hit Copy markdown — the write-up is copied to your clipboard as Markdown, ready to paste into another doc or a chat.
- If the file doesn't include a report, this tab simply stays disabled, so there's nothing to worry about.