
Write an Issue (screenshot mode)
When you finish annotating and click Done, the issue draft opens. Just fill it in top to bottom.
1. Title
Your configured title prefix (e.g. [QA] ) is pre-filled. Type the rest of the title after it.
2. Environment
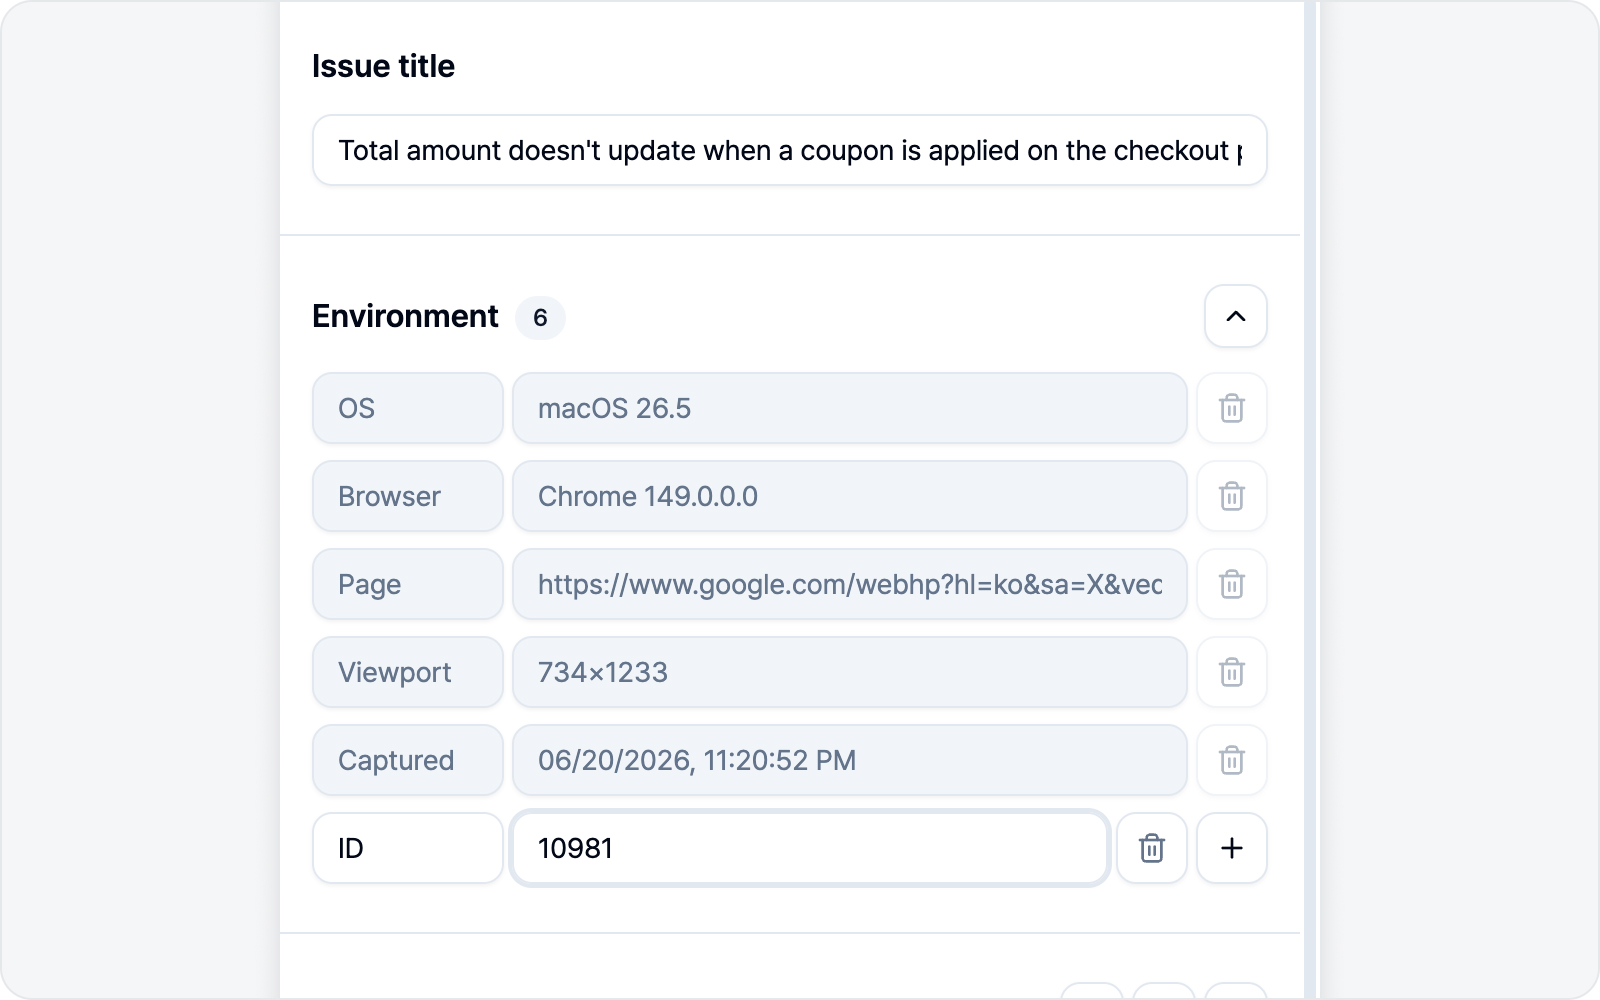 Environment
OS, browser, page URL, viewport size, and capture time fill in on their own (read-only). Want to add more context? Just drop in a variable row yourself.
When the capture ships logs along with it, you may see one more row: API Hosts. We read the captured network log and pull out the API servers that share a domain with the page (the label stays in English on screen). Think of it as a ready-made answer to "so which server should I be looking at?" Whenever this row gets filled in, the Environment section opens already expanded, so give the value a quick look. It's filled in automatically, but it's still just a regular row — edit it or delete it outright if it's not what you want, and once you change the value it stays the way you wrote it.
No row? Nothing is broken. It won't show up when the page only talked to its own address, when you turned log attachment off, or when you captured in Edit element style mode.
3. Media — annotated screenshot
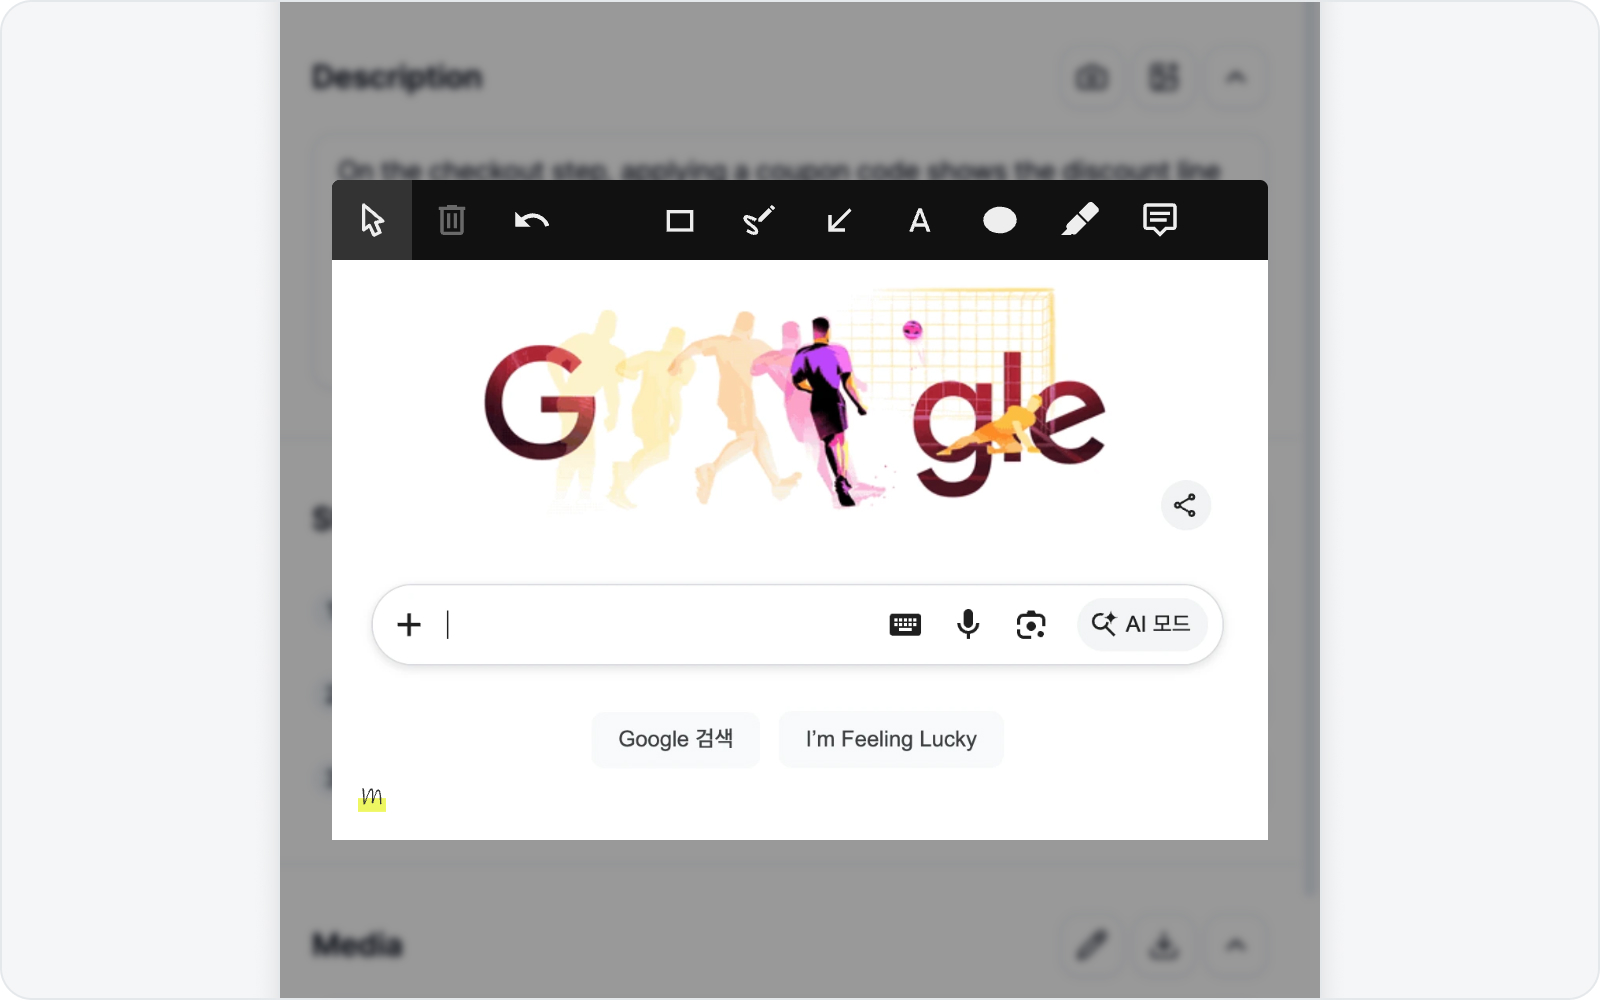 Annotated screenshot attached
The media in screenshot mode is the annotated screenshot. The image you marked up with arrows and boxes is attached to the issue as-is. The Download button on the right of the Media section also lets you save this screenshot as an image file.
4. Body sections
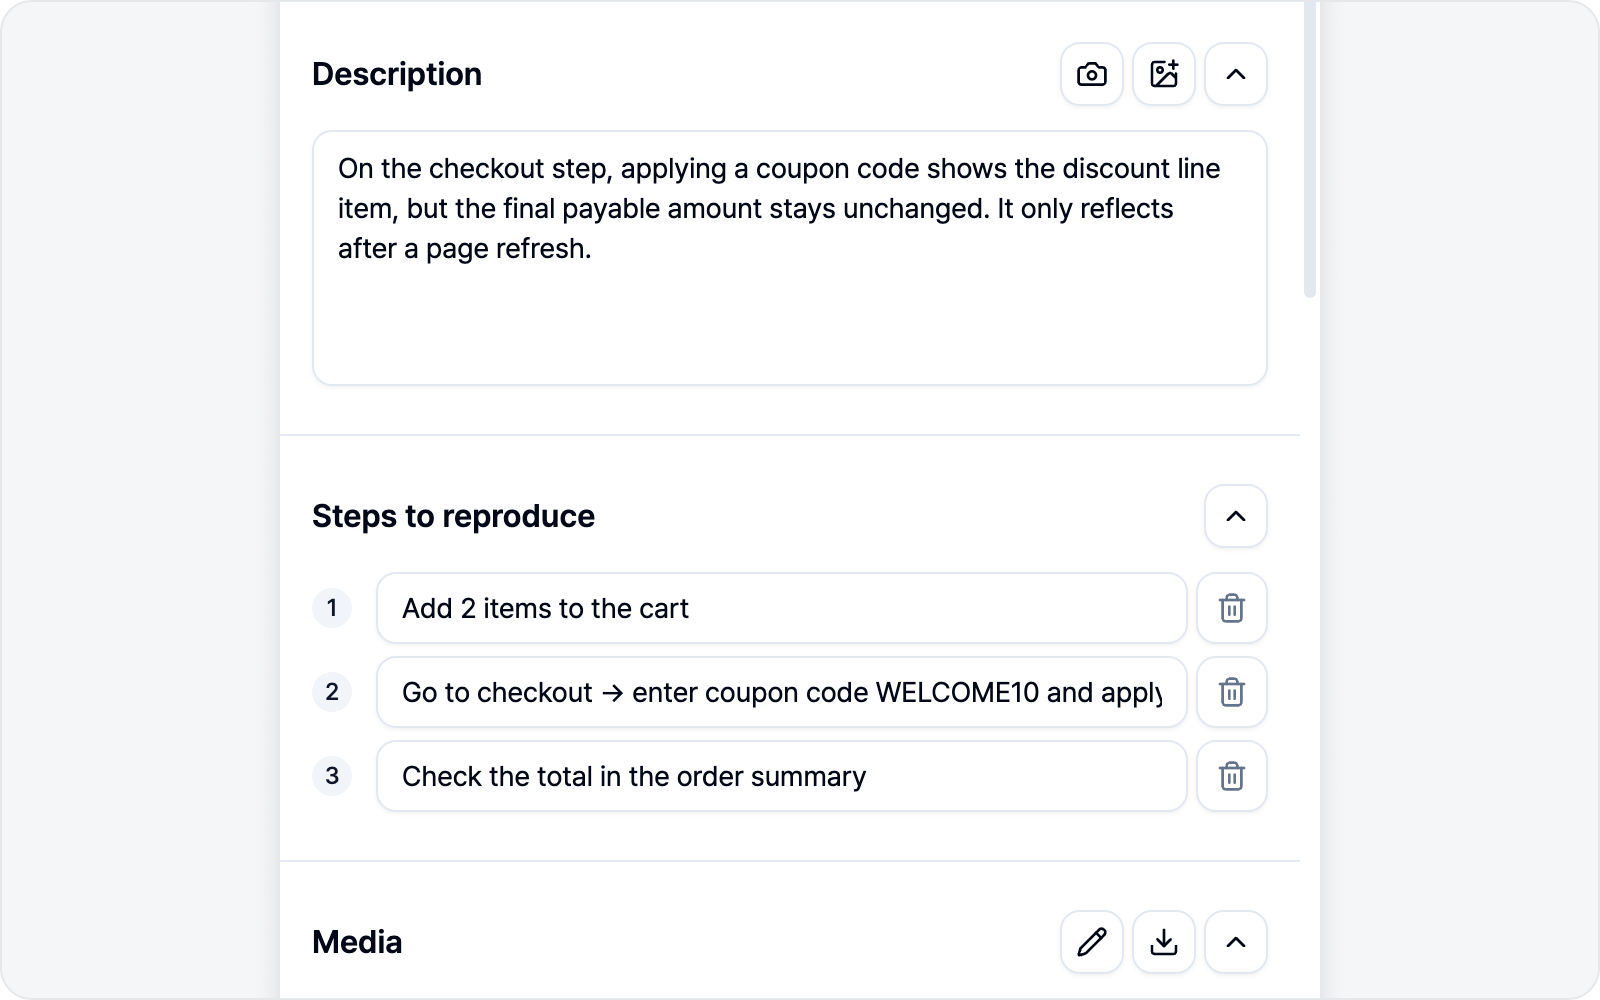 Writing the body
Sections appear per your body composition — Description, Steps to reproduce, Expected result, Notes (only the ones you've turned on). Steps to reproduce is an ordered list. Fill them in by hand, or let AI Draft below do it in one shot.
Pulling the log that matters into the body
Sections you write as prose — Description, Expected result, Notes — have an Add log button on the right of their header (Steps to reproduce is an ordered list, so it doesn't). Instead of describing the response in words, drop the log itself into the body.
The button opens the Add log dialog. Console and Network tabs each show a count badge, and you search and filter exactly as you would in the log tabs. Click the entry you're after, read it in the detail pane, then hit Add.
- Network — carries the request path and status code plus the request and response bodies. Perfect for the "200, but the response says it failed" case the status code alone can't show.
- Console — carries the message the page printed, and the stack trace when it's an error.
What lands is a code block, but it's just text — trim it or edit it however you like. It's separate from the attached logs.html: the attachment only shows up once the reader downloads and opens the file, while a log you add this way is right there in the issue body.
Long logs are nothing to worry about. Any code block over 15 lines lands collapsed, so a single response never swallows the panel. Hover the block and a pill appears at the bottom center — Expand (38 lines), where the number is that block's full line count. Click it to see the whole thing, Collapse to fold it back, and preview behaves the same way. Start editing inside a collapsed block and it opens up on its own, so type away. Folding is purely for comfortable reading — the issue you file always carries the full log.
A log in the body is visible to everyone who can see the issue, and console logs go in verbatim with no masking. If the screen prints anything sensitive, give it a look in the detail pane before you add it.
Annotating an image in the body
Prose sections like Description can hold images too — paste a screenshot, drag a file in, or use the Add image button on the section header. Hover an image that's in the body and a small toolbar appears at its top-right. Annotate opens the same editor as screenshot annotation, so you can point an arrow at the problem or cover something sensitive and have it applied right in place. Once you've annotated at least once, a Restore button joins it — one click brings back the pre-edit original. Drop an image you don't need with Delete.
Editing a body image used to mean deleting it, fixing it elsewhere, and dropping it back in — now you touch it up right where it sits. Both the annotated version and the pre-annotation original live only in your browser, and what goes out with the issue is always the image you see now (annotated, if you annotated it).
✨ AI Draft
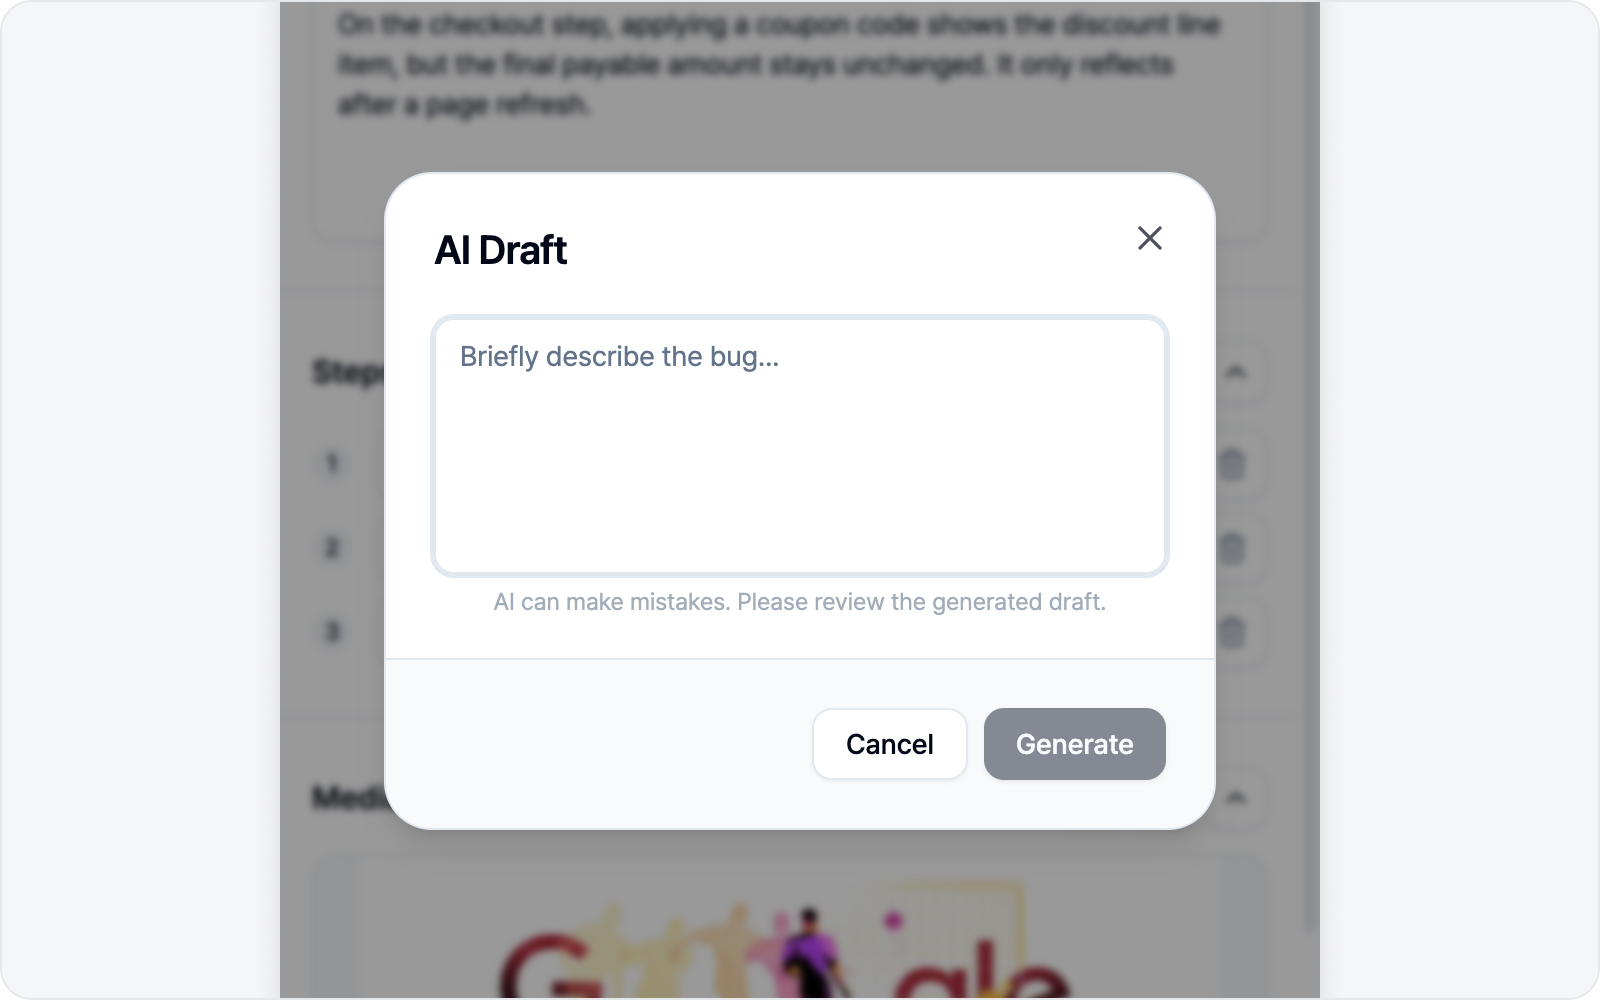 AI Draft banner and input box
If filling in each line by hand feels tedious, this is where AI earns its keep. With an AI connected, a purple "Let AI write your draft" banner shows up right below the body sections.
Click AI Draft on the right and a small input box opens. Describe the bug in a line or two, hit Generate, and AI fills in both the title and the body sections at once. Only the sections you've turned on get filled, and your title prefix stays put. If you've already jotted down a title or body, AI takes that in as context too — and any images you placed in the body stay put, with only the text refreshed.
In screenshot mode, AI reads the annotated screenshot you attached along with a summary of the console, network, and action logs collected so far. A one-line description helps it pin down what's wrong on screen and reflect it in the draft.
If relevant logs were captured, AI does one more thing — it picks the ones directly tied to the bug and drops the actual log, verbatim, as a code block right under the description. It's not just error logs — even a normal-looking 200 response that fits what went wrong (say, an empty list or a missing field) can be picked as the culprit and pasted in. The log text never comes from the AI itself, so there's no made-up stack trace to worry about. If nothing's relevant, nothing gets added — that's normal. Log blocks you inserted yourself survive a regenerate, and you can always delete a block you don't need.
AI slips up now and then, so give the generated draft a quick look. The banner only shows when an AI is connected — see AI LLM Connection for how.
5. Log attachments
Screenshot mode attaches three kinds of logs too. The log section shows a single logs.html card with its switch on by default — that one switch attaches or drops all three logs together (there's no per-log toggle). The card summarizes which kinds were captured and how many.
- Console Logs — Console output and errors from the session so far.
- Network Logs — Network requests made along the way.
- Action Logs — Clicks, text input, navigation, shortcuts, toggles, dropdown selections, and drag-and-drop — everything you did on the way to the screenshot, captured as reproduction steps.
Click the card and it opens a window split into Console, Network, and Action tabs — check what each log actually holds, and hit Detach at the bottom to leave them out.
Logs keep collecting the whole time the side panel is open, so whatever happened before you hit capture is already in there.
Values you type into fields and pick from dropdowns are recorded as-is, unless they look sensitive. Knowing which value broke things is usually the whole point of a repro. See the Log Viewer for the exact rules and what to watch out for.
The Download button on the right of the Log attachments section lets you grab the same log report (logs.html) that gets attached to the issue — right here, before you even submit.
See Live Logs for how to read and work with logs.
6. Preview
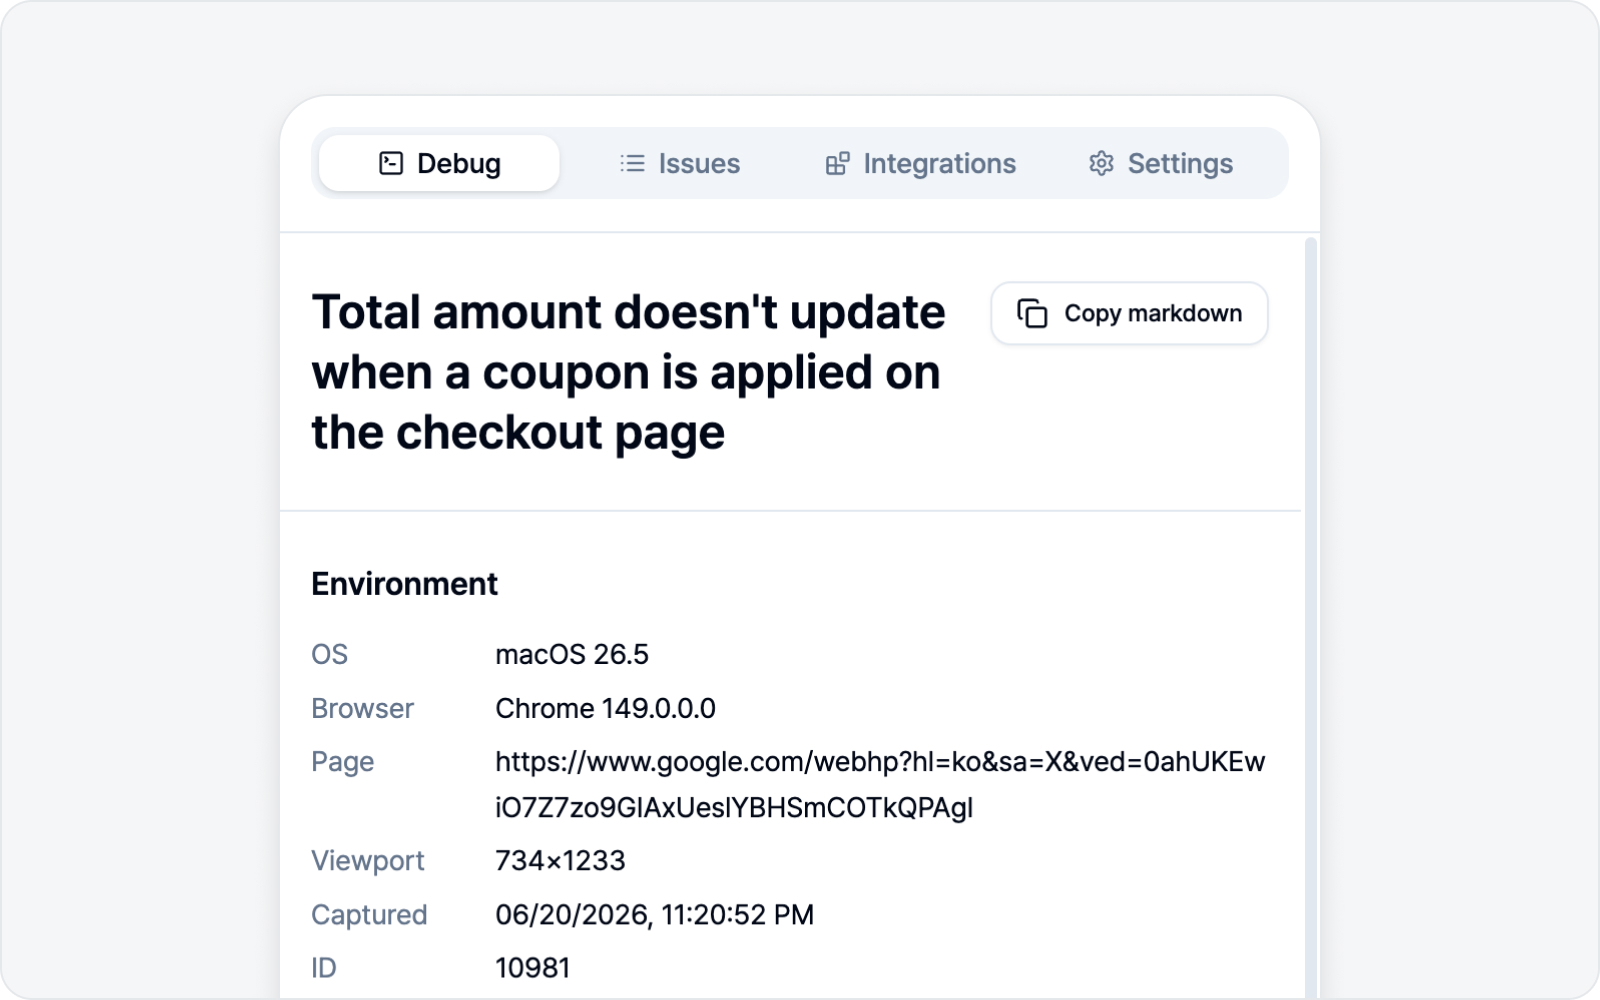 Issue preview
Give the body a look in the preview before submitting. Copy puts it on your clipboard as Markdown, ready to paste into another doc or a chat.
Copies leave out images and log files. An image on the clipboard makes editors like Notion and Jira refuse the paste outright — you'd lose the whole write-up — so we keep the text and leave a short note where each image was. Submit the issue and your images and logs are attached as usual.
7. Submit
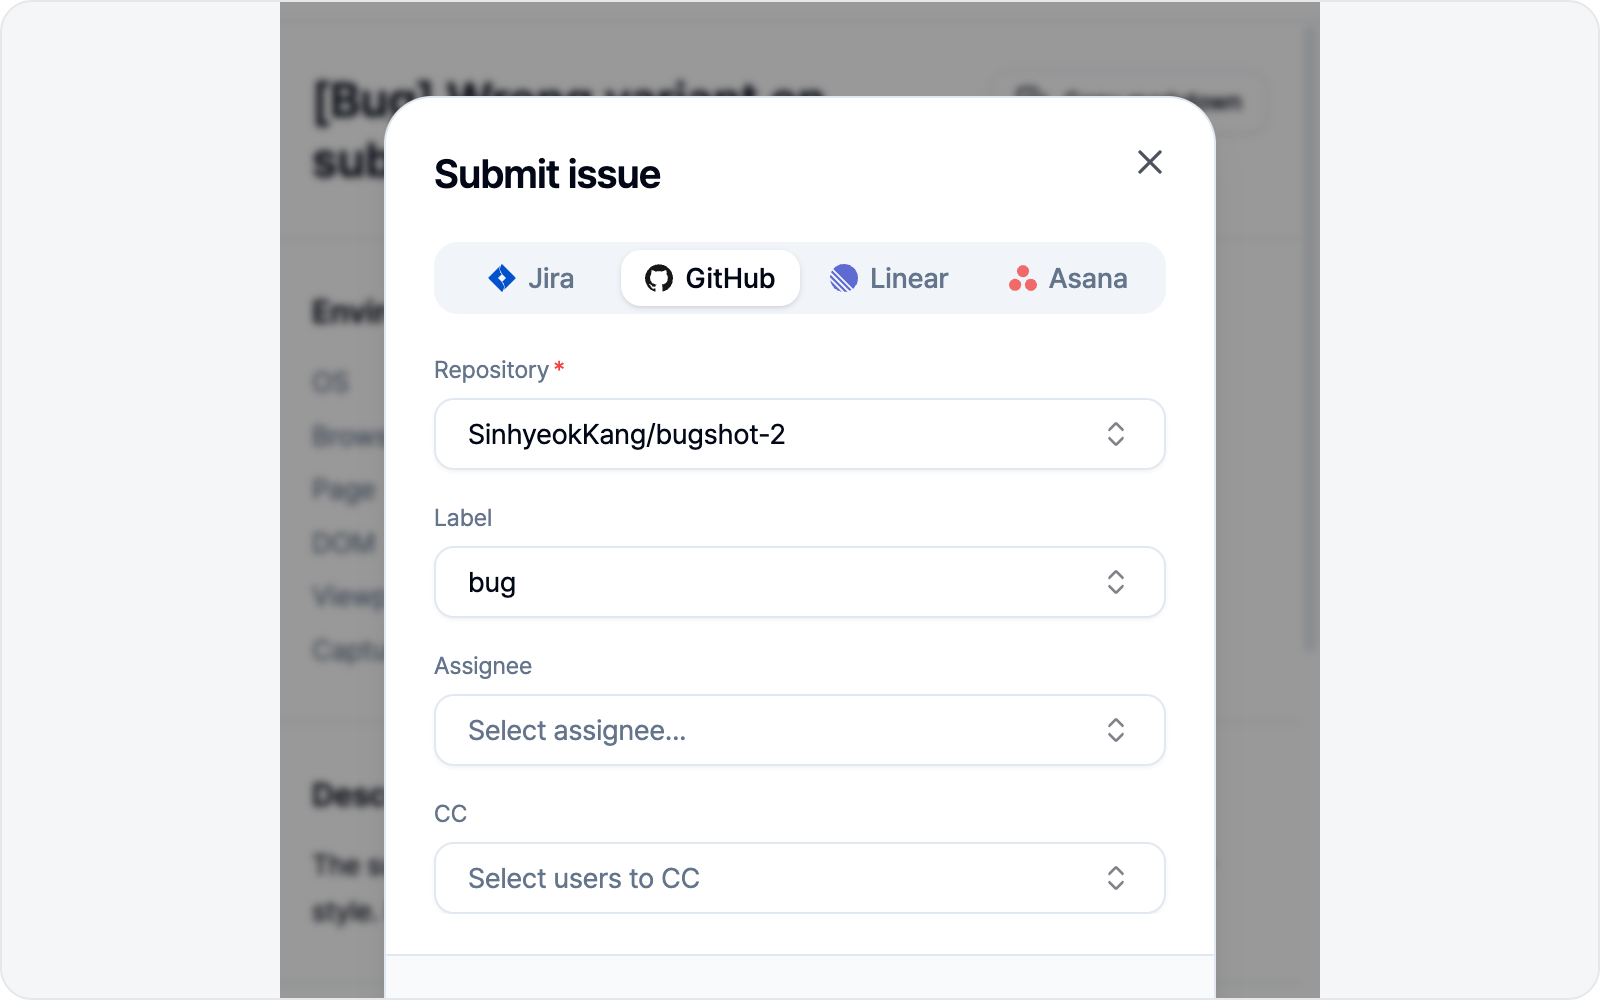 Issue submitted
Fill in the connected platform's fields (project, assignee, labels, etc.) and hit Submit issue. A link to the created issue appears when it's done.
If an attachment needs attention, check its status and Download the saved file from the completion screen. You can reopen the details later from Issues. If registration could not be confirmed, check the destination before trying to submit again.
At the bottom of the fields sits a CC field. Pick the folks who should be in the loop on this bug (reviewers, designers, PMs) and they land as a cc @name mention at the bottom of the created issue, each getting a notification on the platform. Select several at once and search by name to find them fast. Whoever you pick is pre-filled on your next issue too, so you don't have to reselect every time.
CC unlocks once you've picked the parent item first — repo, team, project, or workspace. Notion is the one exception: its connected integration needs the "read user information" permission to load the member list, so if it comes up empty, reconnect Notion in Settings.